
Cross Mountain, Texas
Cross Mountain, Texas | |
|---|---|
 | |
| Coordinates: 29°39′20″N 98°39′34″W / 29.65556°N 98.65944°W | |
| Country | United States |
| State | Texas |
| County | Bexar |
| Area | |
| • Total | 6.7 sq mi (17.4 km2) |
| • Land | 6.7 sq mi (17.4 km2) |
| • Water | 0.0 sq mi (0.0 km2) |
| Elevation | 1,401 ft (427 m) |
| Population (2020) | |
| • Total | 3,944 |
| • Density | 590/sq mi (230/km2) |
| Time zone | UTC-6 (Central (CST)) |
| • Summer (DST) | UTC-5 (CDT) |
| Zip Code | 78255, 78256 |
| FIPS code | 48-17811[2] |
| GNIS feature ID | 1867546[1] |
| ANSI Code | 2407686[3] |
Cross Mountain is a census-designated place (CDP) in Bexar County, Texas, United States. The population was 3,944 at the 2020 census,[4] an increase over the figure of 3,124 tabulated in 2010. It is part of the San Antonio Metropolitan Statistical Area.
Geography
[edit]Cross Mountain is located in northwestern Bexar County. It is bordered by the city of San Antonio to the east and the CDP of Scenic Oaks to the north. Downtown San Antonio is 22 miles (35 km) to the southeast.
According to the United States Census Bureau, the CDP has a total area of 6.7 square miles (17.4 km2), all land.[4]
Demographics
[edit]| Census | Pop. | Note | %± |
|---|---|---|---|
| 1990 | 1,112 | — | |
| 2000 | 1,524 | 37.1% | |
| 2010 | 3,124 | 105.0% | |
| 2020 | 3,944 | 26.2% | |
| U.S. Decennial Census[5] 1850–1900[6] 1910[7] 1920[8] 1930[9] 1940[10] 1950[11] 1960[12] 1970[13] 1980[14] 1990[15] 2000[16] 2010[17] 2020[18] | |||
Cross Mountain first appeared as a census designated place in the 1990 U.S. Census.[15]
2020 census
[edit]| Race / Ethnicity (NH = Non-Hispanic) | Pop 2000[19] | Pop 2010[20] | Pop 2020[18] | % 2000 | % 2010 | % 2020 |
|---|---|---|---|---|---|---|
| White alone (NH) | 1,154 | 1,993 | 2,116 | 75.72% | 63.80% | 53.65% |
| Black or African American alone (NH) | 40 | 103 | 106 | 2.62% | 3.30% | 2.69% |
| Native American or Alaska Native alone (NH) | 5 | 8 | 5 | 0.33% | 0.26% | 0.13% |
| Asian alone (NH) | 21 | 79 | 207 | 1.38% | 2.53% | 5.25% |
| Pacific Islander alone (NH) | 0 | 2 | 7 | 0.00% | 0.06% | 0.18% |
| Other Race alone (NH) | 12 | 3 | 25 | 0.79% | 0.10% | 0.63% |
| Mixed race or Multiracial (NH) | 10 | 57 | 175 | 0.66% | 1.82% | 4.44% |
| Hispanic or Latino (any race) | 282 | 879 | 1,303 | 18.50% | 28.14% | 33.04% |
| Total | 1,524 | 3,124 | 3,944 | 100.00% | 100.00% | 100.00% |
As of the 2020 United States census, there were 3,944 people, 909 households, and 812 families residing in the CDP.
As of the census[2] of 2000, there were 1,524 people, 529 households, and 464 families residing in the CDP. The population density was 207.6 inhabitants per square mile (80.2/km2). There were 555 housing units at an average density of 75.6 per square mile (29.2/km2). The racial makeup of the CDP was 90.88% White, 2.62% African American, 0.52% Native American, 1.44% Asian, 3.28% from other races, and 1.25% from two or more races. Hispanic or Latino of any race were 18.50% of the population.
There were 529 households, out of which 38.4% had children under the age of 18 living with them, 78.6% were married couples living together, 6.6% had a female householder with no husband present, and 12.1% were non-families. 9.3% of all households were made up of individuals, and 3.4% had someone living alone who was 65 years of age or older. The average household size was 2.85 and the average family size was 3.00.
In the CDP, the population was spread out, with 25.3% under the age of 18, 4.9% from 18 to 24, 25.6% from 25 to 44, 32.9% from 45 to 64, and 11.4% who were 65 years of age or older. The median age was 42 years. For every 100 females, there were 100.5 males. For every 100 females age 18 and over, there were 104.1 males.
The median income for a household in the CDP was $102,628, and the median income for a family was $104,744. Males had a median income of $64,821 versus $37,228 for females. The per capita income for the CDP was $40,549. About 2.2% of families and 3.8% of the population were below the poverty line, including 5.1% of those under age 18 and none of those age 65 or over.
Education
[edit]Cross Mountain is served by the Northside Independent School District.[21]
Students are zoned to:
- Ellison Elementary School and Leon Springs Elementary School[22]
- Hector Garcia Middle School (San Antonio)[23]
- Louis D. Brandeis High School[24]
References
[edit]- ^ a b U.S. Geological Survey Geographic Names Information System: Cross Mountain, Texas
- ^ a b "U.S. Census website". United States Census Bureau. Retrieved January 31, 2008.
- ^ "US Gazetteer Files 2016-Places-Texas". US Census. Retrieved January 24, 2017.
- ^ a b "Geographic Identifiers: 2010 Demographic Profile Data (G001): Cross Mountain CDP, Texas". U.S. Census Bureau, American Factfinder. Archived from the original on February 12, 2020. Retrieved April 15, 2014.
- ^ "Decennial Census by Decade". United States Census Bureau.
- ^ "1900 Census of Population - Population of Texas By Counties And Minor Civil Divisions" (PDF). United States Census Bureau.
- ^ "1910 Census of Population - Supplement for Texas" (PDF). United States Census Bureau.
- ^ "1920 Census of Population - Number of Inhabitants - Texas" (PDF). United States Census Bureau.
- ^ "1930 Census of Population - Number of Inhabitants - Texas" (PDF). United States Census Bureau.
- ^ "1940 Census of Population - Number of Inhabitants - Texas" (PDF). United States Census Bureau.
- ^ "1950 Census of Population - Number of Inhabitants - Texas" (PDF). United States Census Bureau.
- ^ "1960 Census of Population - Number of Inhabitants - Texas" (PDF). United States Census Bureau.
- ^ "1970 Census of Population - Number of Inhabitants - Texas" (PDF). United States Census Bureau.
- ^ "1980 Census of Population - Number of Inhabitants - Texas" (PDF). United States Census Bureau.
- ^ a b "1990 Census of Population - Population and Housing Unit Counts - Texas" (PDF). United States Census Bureau.
- ^ "2000 Census of Population - Population and Housing Unit Counts - Texas" (PDF). United States Census Bureau.
- ^ "2010 Census of Population - Population and Housing Unit Counts - Texas" (PDF). United States Census Bureau.
- ^ a b "P2: Hispanic or Latino, and Not Hispanic or Latino by Race – 2020: DEC Redistricting Data (PL 94-171) – Cross Mountain, Texas". United States Census Bureau.
- ^ "P004: Hispanic or Latino, and Not Hispanic or Latino by Race – 2000: DEC Summary File 1 – Cross Mountain, Texas". United States Census Bureau.
- ^ "P2: Hispanic or Latino, and Not Hispanic or Latino by Race – 2010: DEC Redistricting Data (PL 94-171) – Cross Mountain, Texas". United States Census Bureau.
- ^ "2010 CENSUS - CENSUS BLOCK MAP: Cross Mountain CDP, TX." U.S. Census Bureau. Retrieved on September 8, 2016.
- ^ "2016-17 Elementary School Attendance Areas Archived 2016-09-08 at the Wayback Machine." Northside Independent School District. Retrieved on September 8, 2016.
- ^ "2016-17 Middle School Attendance Areas." Northside Independent School District. Retrieved on September 8, 2016.
- ^ "2016-17 High School Attendance Areas Archived 2016-09-08 at the Wayback Machine." Northside Independent School District. Retrieved on September 8, 2016.
Municipalities and communities of Bexar County, Texas, United States | ||
|---|---|---|
| Cities | 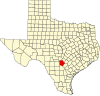 | |
| Towns | ||
| CDPs | ||
| Other communities | ||
| Ghost towns | ||
| Footnotes | ‡This populated place also has portions in an adjacent county or counties | |